TauPlot
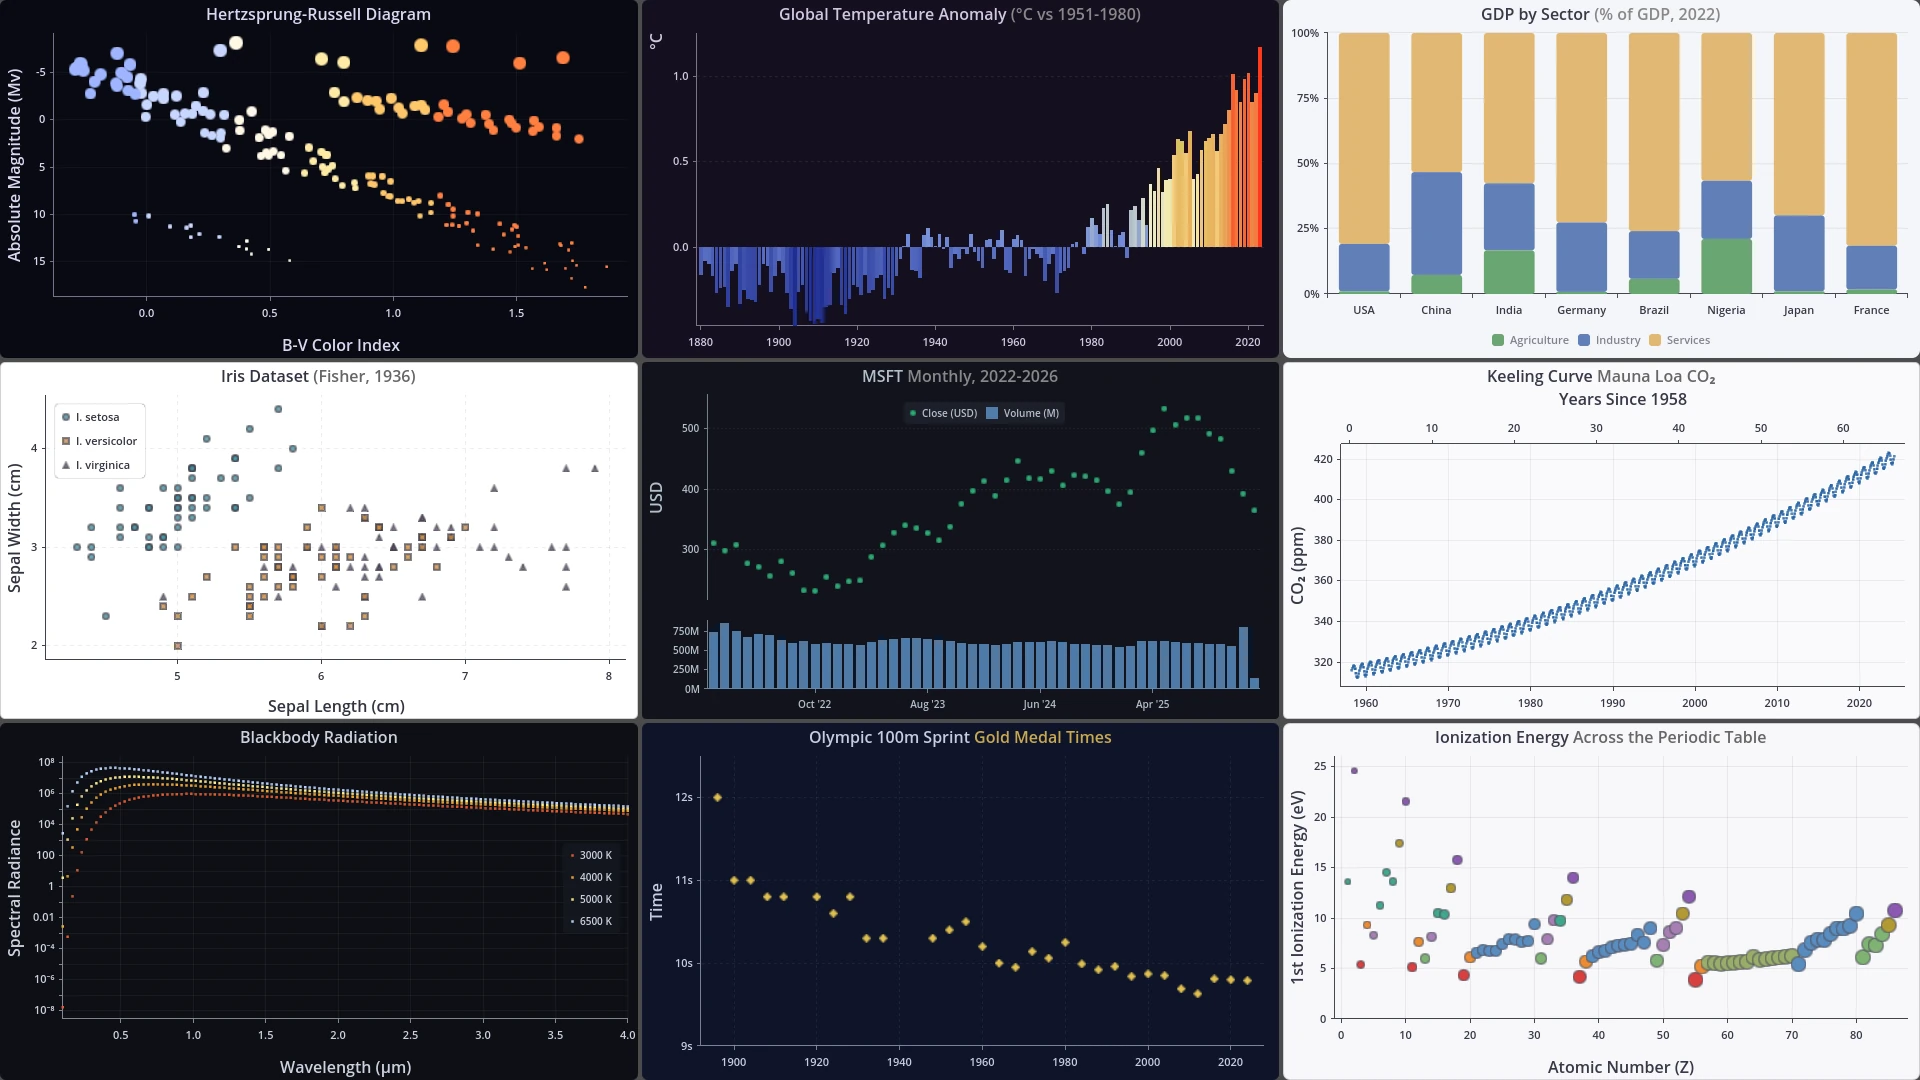
TauPlot is a pure GDScript charting addon for Godot 4.5+ with no external dependencies. It draws interactive, performant and themeable plots inside any Godot UI.
Features
- Bar, line, and scatter overlays in any combination. Bars can be grouped, stacked, or independent, lines can be independent or stacked, both support optional normalization, and a line can carry a flat or textured area fill.
- Axes can be categorical or continuous, linear or logarithmic, inverted, and placed on any edge. A pane can carry two Y axes with optional alignment at zero, and a secondary X axis shows the same range in another unit through a custom transform.
- Automatic tick and label generation with overlap prevention. Ticks and labels adapt to the available space so they stay readable at any size, with no manual tuning required. The preferred tick count, overlap strategy, and minimum spacing are configurable, and the axis domain can be overridden with a fixed range when needed.
- Real-time streaming through ring-buffer datasets that drop the oldest samples automatically.
- Multi-pane layouts for displaying series with different Y scales (for example, price above volume).
- Per-sample styling via attribute buffers or callbacks for color, alpha, marker shape, and more.
- Full Godot theme integration with a three-layer cascade (built-in defaults, theme, code overrides) across every visual property.
- Hover inspection with tooltip, crosshair, highlight, and interaction signals.
Quick start
Create a scene where the root node is a CenterContainer. Add a TauPlot node child and name it MyPlot. Attach a script to the root node with the following content:
extends CenterContainer

func _ready() -> void:
    var dataset := TauPlot.Dataset.make_shared_x_categorical(
        PackedStringArray(["Revenue", "Costs"]),
        PackedStringArray(["Q1", "Q2", "Q3", "Q4"]),
        [
            PackedFloat64Array([120.0, 135.0, 148.0, 160.0]),
            PackedFloat64Array([90.0, 95.0, 100.0, 108.0]),
        ]
    )

    var x_axis := TauAxisConfig.new()
    x_axis.type = TauAxisConfig.Type.CATEGORICAL

    var y_axis := TauAxisConfig.new()
    y_axis.title = "EUR"

    var bar_overlay_config := TauBarConfig.new()

    var pane := TauPaneConfig.new()
    pane.y_left_axis = y_axis
    pane.overlays = [bar_overlay_config]

    var config := TauXYConfig.new()
    config.x_axis = x_axis
    config.panes = [pane]

    var b0 := TauXYSeriesBinding.new()
    b0.series_id = dataset.get_series_id_by_index(0)
    b0.pane_index = 0
    b0.overlay_type = TauXYSeriesBinding.PaneOverlayType.BAR
    b0.y_axis_id = TauPlot.AxisId.LEFT

    var b1 := TauXYSeriesBinding.new()
    b1.series_id = dataset.get_series_id_by_index(1)
    b1.pane_index = 0
    b1.overlay_type = TauXYSeriesBinding.PaneOverlayType.BAR
    b1.y_axis_id = TauPlot.AxisId.LEFT

    var bindings: Array[TauXYSeriesBinding] = [b0, b1]

    $MyPlot.title = "Quick Start Example"
    $MyPlot.plot_xy(dataset, config, bindings)
Run the scene and you get:
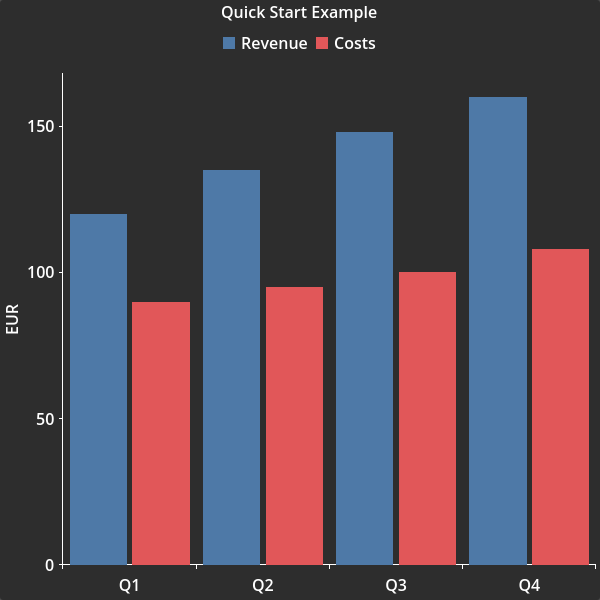
A complete, runnable version of this example is available here.
Documentation
- Getting Started walks through building your first plot step by step.
- API Reference covers every class, property, enum, and signal.
- Runtime Configuration Change Limitations lists the configuration properties that can be changed after the plot is built.
demo_1.gdis an advanced example with nine plots showing theme customization and per-sample styling through attribute buffers and callbacks.demo_2.gdis an advanced example with three plots showing line overlays with textured area fills, a real-time sweep, and a multi-pane layout.- Tests can provide good examples of how to use some features.
Stability
The API may change between releases until version 1.0 is reached. Breaking changes will be documented in the changelog. Backward compatibility is taken seriously and disruption will be kept to a minimum, but at this stage correctness and design quality take priority over freezing the API.
If you encounter a bug, please open an issue on the GitHub repository. Feedback from early adopters directly shapes the road to a stable 1.0.
Contributing
Contributions are welcome. See CONTRIBUTING.md for details.
Roadmap
The following features are planned for upcoming releases:
- Interactive legend with click-to-toggle series visibility.
- Zoom and pan with the mouse wheel and drag.
- Data labels, showing the value of each sample next to it.
- Minor tick generation on linear scales.
- Symmetric logarithmic (symlog) axis scale.
- Pie and radar plot types.
License
TauPlot is released under the BSD 3-Clause License. See the full license text for details.
Changelog for version tau-plot v0.2.1
2026-10-15 11:38:07
No changelog provided for this version.